
162 Pageviews, Four of Them Australian: What Our First 2.5 Days of Data Actually Measured
We stood up first-party analytics across five brand sites and left it running. Two and a half days later the numbers looked like this:
162 pageviews
  United States   64%
  Singapore       13%
  China            7%
  Australia        2%   (4 pageviews)

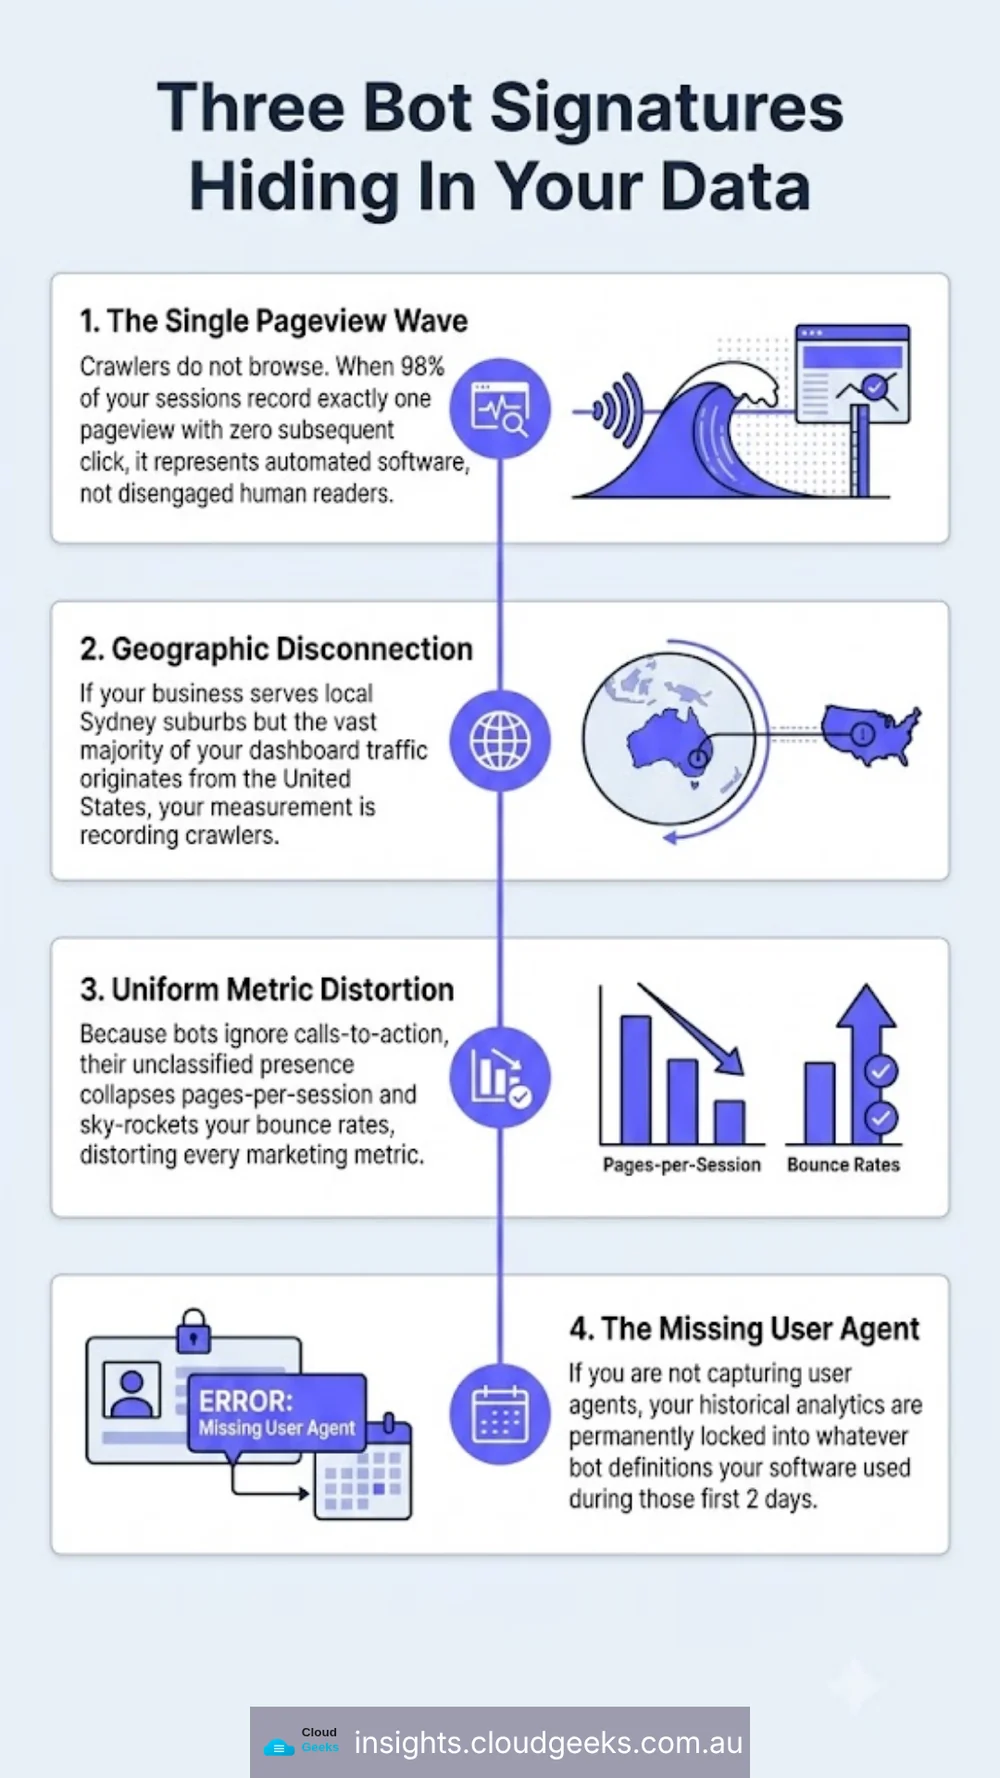
98% of sessions were exactly ONE pageview
Every one of those five sites sells to businesses in Sydney. Four Australian pageviews in two and a half days is not an audience. Neither is a 98% single-pageview rate — real people click something, eventually.
This is what crawler traffic looks like when nothing has filtered it out yet.
Why this matters more than it looks
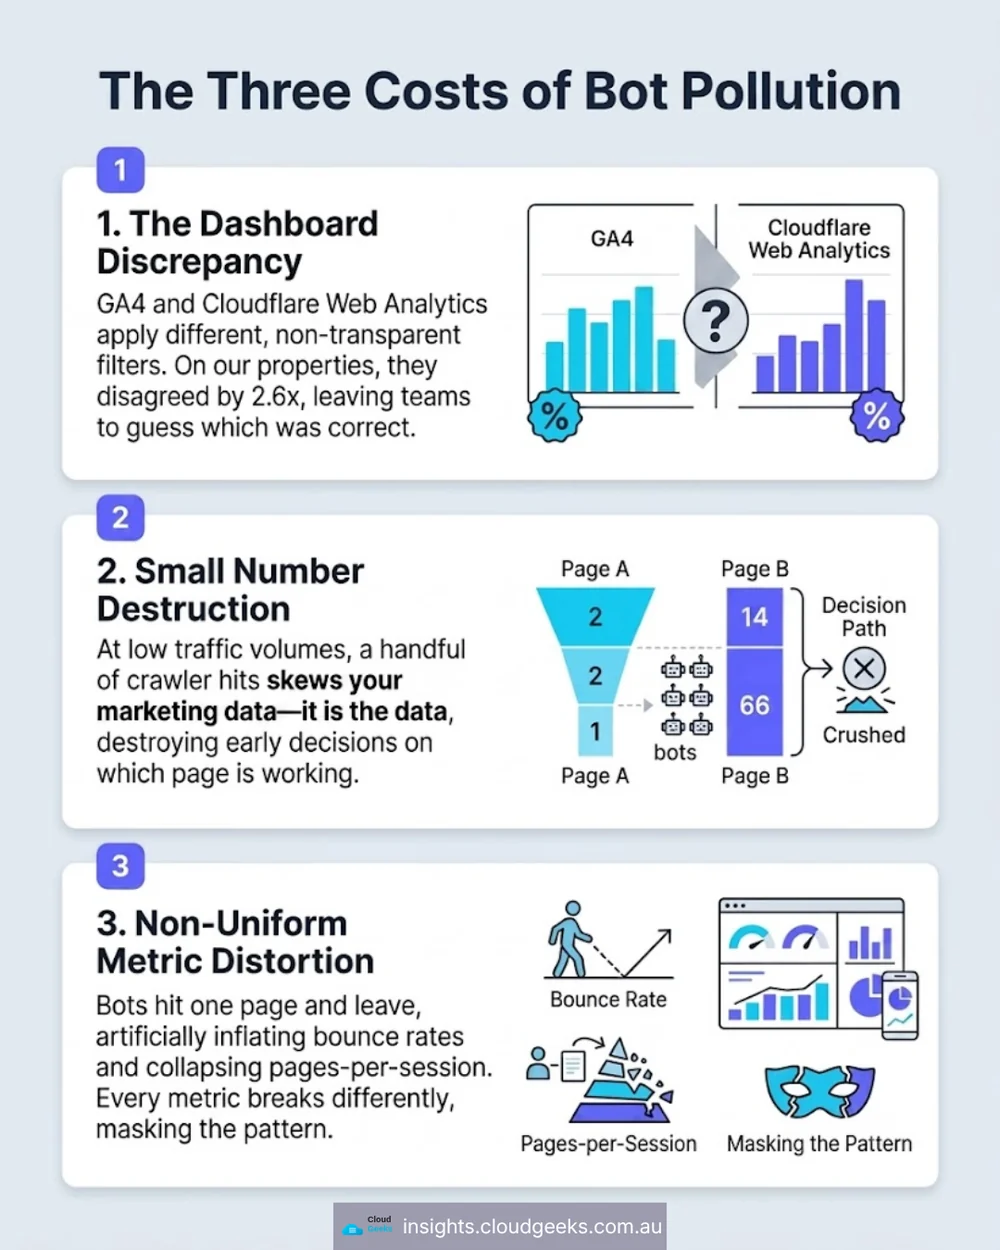
The interesting part is not that bots visit websites. Everyone knows bots visit websites. The interesting part is what happens next, in three directions at once.
Your dashboards disagree and you cannot tell which is right. GA4 and Cloudflare Web Analytics apply different filters, and neither shows you the filter. On one of our properties the two disagreed by roughly 2.6×. Without a raw stream to compare against, that gap is unarguable in both directions — you can pick the number you prefer and defend it all week.
Small numbers get destroyed. At 162 pageviews, a handful of crawler hits does not skew the data, it is the data. Every early-stage measurement decision — which page is working, which brand is getting traction — would have been made on a signal that was 98% noise.
The distortion is not uniform. Crawlers do not browse like people. They hit one page, ignore your calls to action, and never come back. So bounce rate inflates, pages-per-session collapses, and conversion rate divides by a denominator full of software. Each metric breaks differently, which makes the pattern hard to spot from any single chart.
What we did, and the one decision that mattered
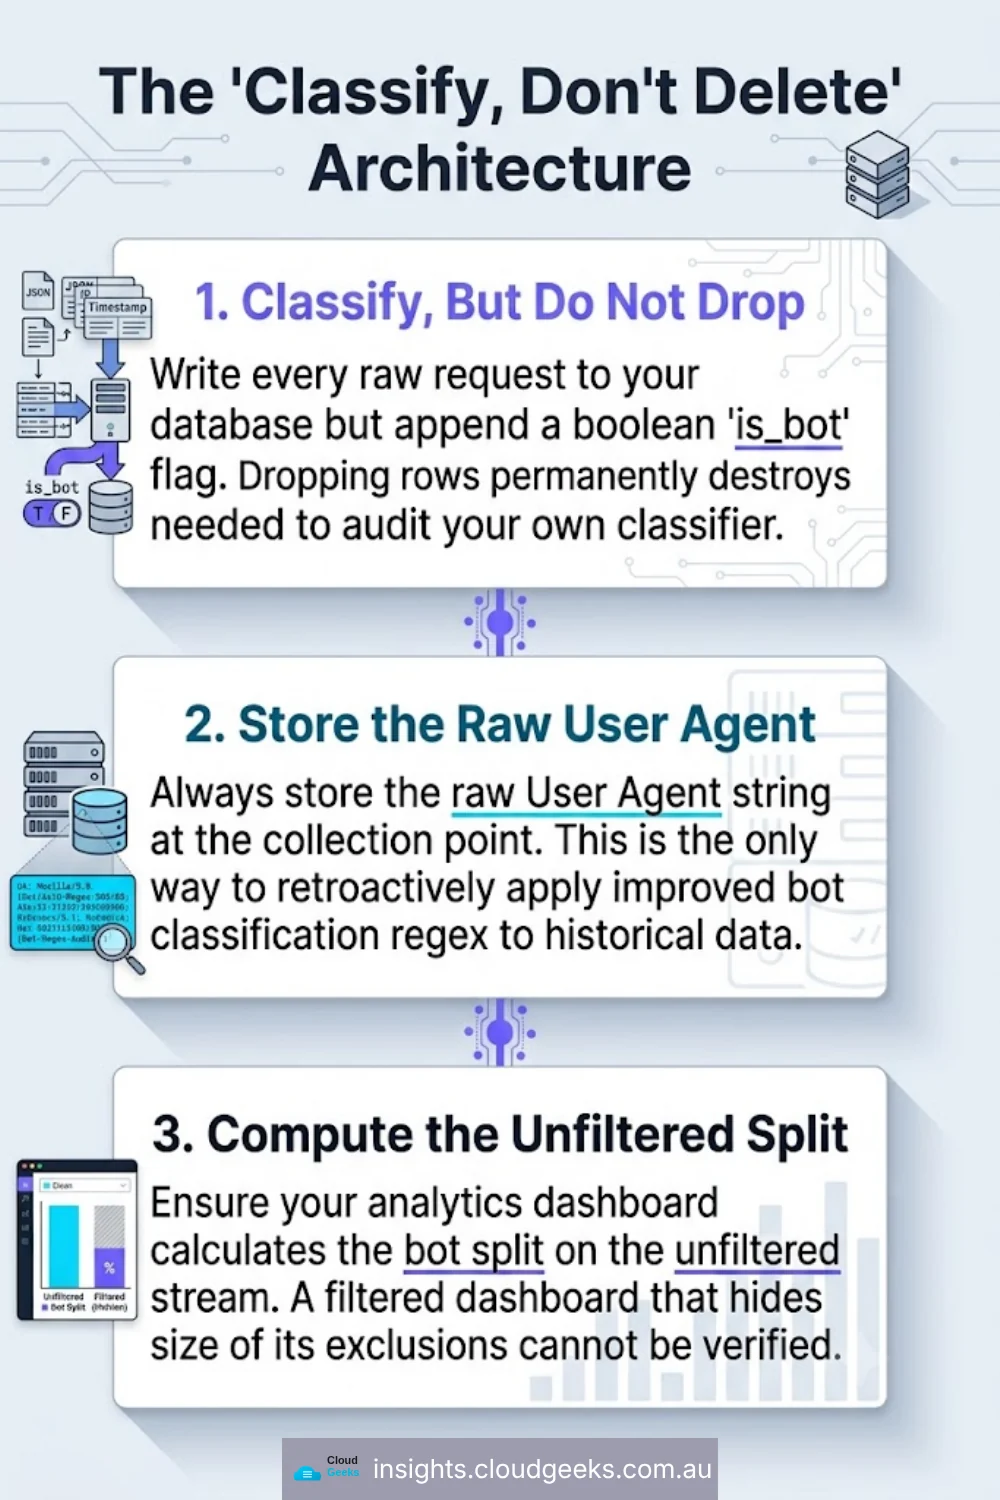
The fix was two changes to a Cloudflare Pages Function. The second is the one worth copying.
1. Classify, but do not drop
We added a bot flag and a ua column at the collection point. Bots are identified by a conservative regex over self-declared crawler user agents, and excluded from /api/stats by default. ?bots=include returns the raw stream.
The important word is flag. The obvious implementation is to detect a bot and simply not write the row — it keeps the database smaller and the default view clean. We deliberately did not:
A dropped row is a number you can never audit.
Once you discard a request, you have destroyed the evidence needed to check your own classifier. If the regex is too aggressive and starts eating real visitors on an unusual browser, there is no way to find out and no way to recover the lost data. Keeping the row and marking it costs a boolean.
Storing the raw user agent is the same argument one level deeper. A better classifier can be applied retroactively to everything we have kept. We could not do that for the first 2.5 days, because at that point we were not storing the UA — those pageviews are classified forever by whatever we thought a bot looked like at the time.
2. Never let the default view hide the size of the exclusion
botSplit is always computed on the unfiltered stream, even when the response is filtered.
This is a small piece of code and the whole point of the exercise. A filtered dashboard that does not tell you what it removed is a claim you cannot check — it hands you a number of human pageviews and says nothing about how many it discarded to get there. The next person to read it has no way of knowing whether the filter is doing something sensible or quietly hiding most of the traffic.
Showing both numbers side by side turns the filter from an invisible policy into a visible one. If the split ever looks wrong, you can see that it looks wrong.
The domain we were not counting
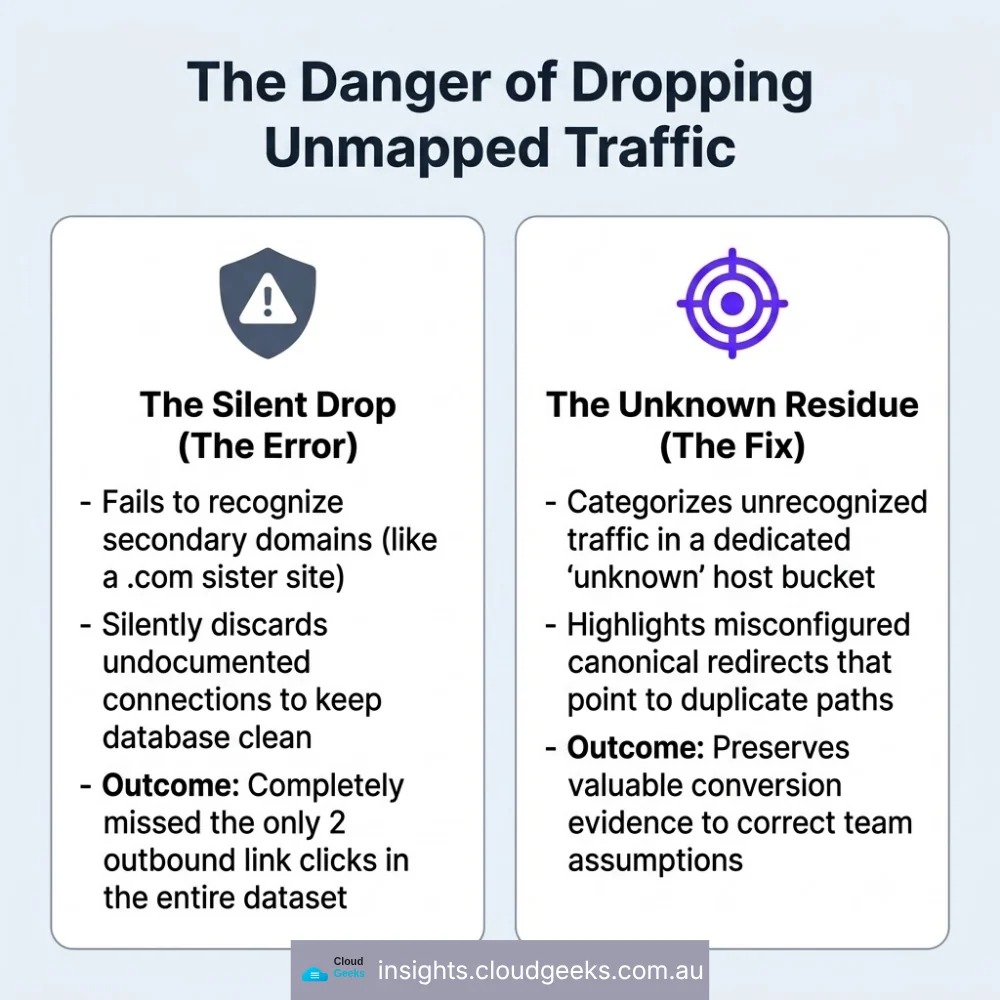
The same first read surfaced something the sampling would never have caught.
One of our brands serves on both a .com.au and a .com. The .com was not in the host map, so its traffic landed in an unknown bucket — 16 pageviews, and the only two outbound link clicks recorded anywhere in the estate.
The .com is not a typo or a parked redirect. It answers 200 with the full site and a canonical pointing at the .com.au. It had simply never been added to the list of hosts we recognised, so the only engagement signal in the entire dataset was sitting in a bucket labelled we don’t know what this is.
Two lessons in one:
- An
unknownbucket is a feature. If those 16 pageviews had been silently dropped as unrecognised, the outbound clicks would have gone with them. - The first thing to check in new analytics is not the totals. It is the residue — the rows that did not fit any of your categories. That is where your assumptions are wrong.
If you are setting this up yourself
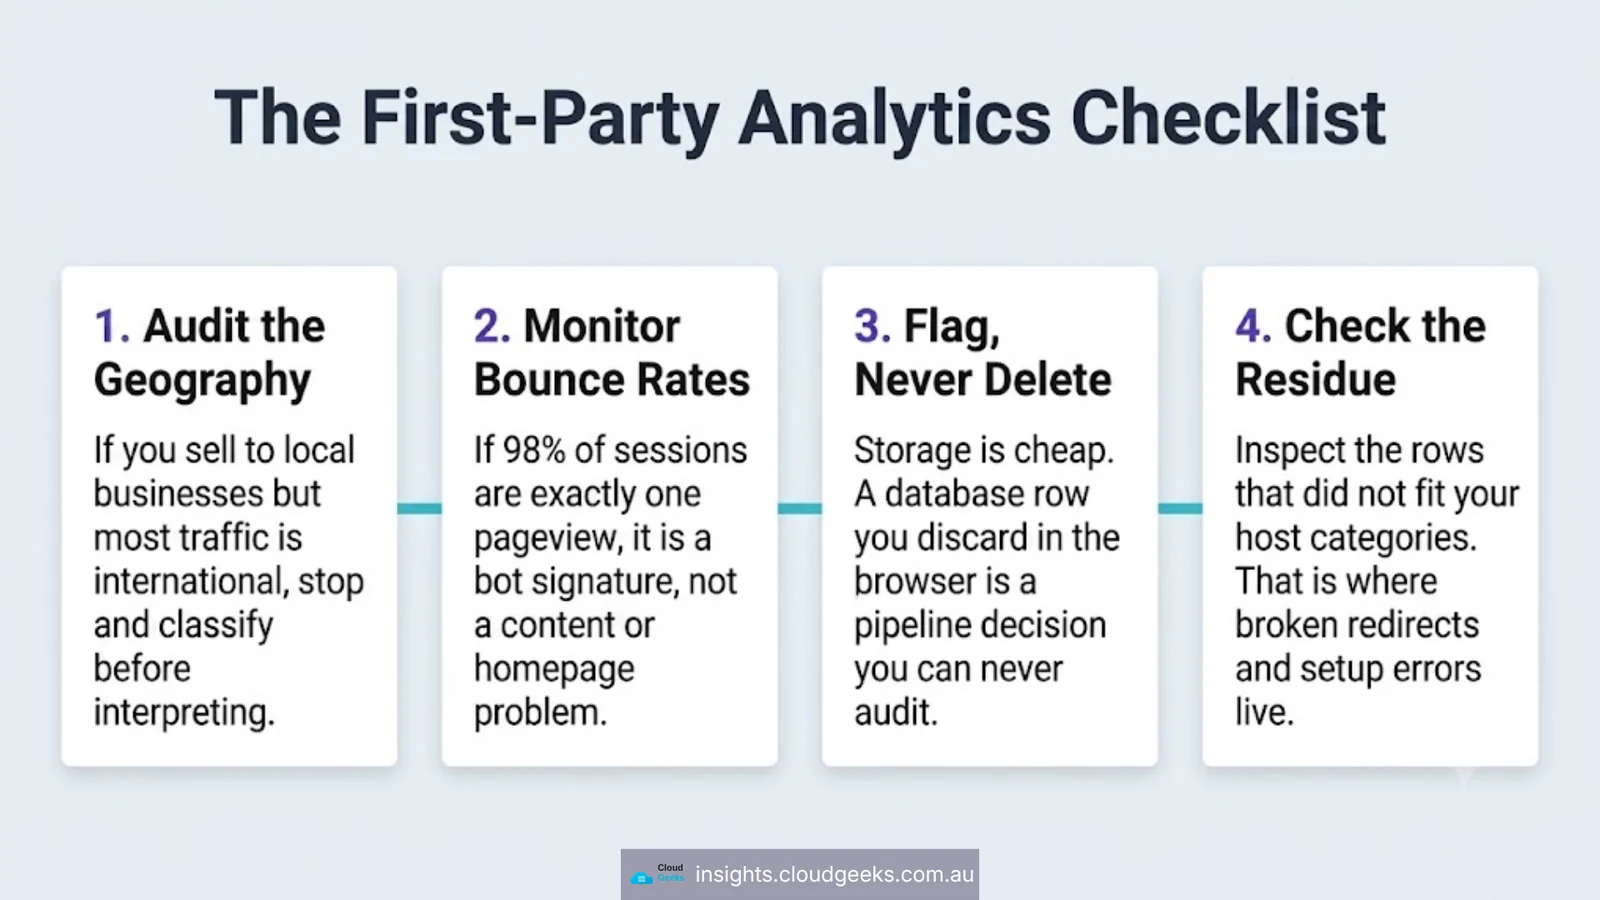
Read the geography first. If you sell in one city and most of your traffic is from three other countries, stop and classify before you interpret anything.
Watch the single-pageview rate. 98% of sessions being one pageview is a bot signature, not a content problem. Nobody needs to redesign a homepage over it.
Flag, never delete. Storage is cheap. A row you discarded is a decision you can never revisit.
Store the user agent. It is the only thing that lets you improve the classifier without throwing away history.
Publish the split. Any filtered number should carry the size of what it filtered, in the same view, always.
One honest caveat on our own numbers: this is 2.5 days on five small sites, and one of those sites turned out not to be firing analytics at all — a separate problem we are still working through. These figures describe our measurement, not our market. That is the point of getting the measurement right first.
Cloud Geeks builds and runs cloud infrastructure for Australian businesses, including the boring parts like making sure the numbers on your dashboard mean something.